Investor Relations
Financial Highlights
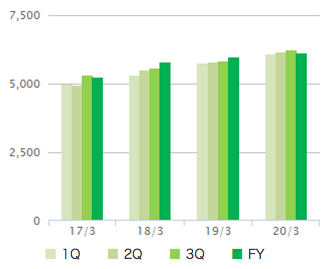
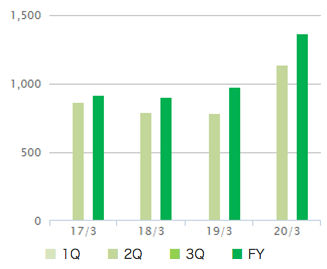
Net sales
(Millions of yen)
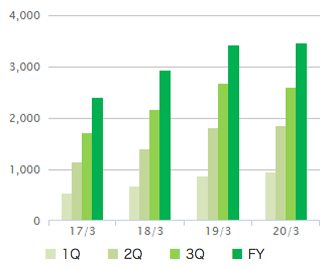
| 17/3 | 18/3 | 19/3 | 20/3 | |
|---|---|---|---|---|
| FY | 2,392 | 2,922 | 3,417 | 3,465 |
| 3Q | 1,724 | 2,164 | 2,672 | 2,594 |
| 2Q | 1,148 | 1,399 | 1,804 | 1,849 |
| 1Q | 541 | 682 | 869 | 945 |
Operating income (loss)
(Millions of yen)
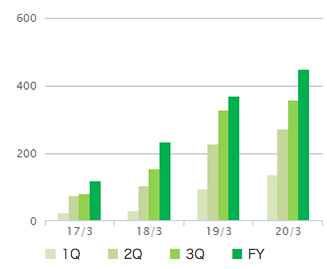
| 17/3 | 18/3 | 19/3 | 20/3 | |
|---|---|---|---|---|
| FY | 120 | 234 | 368 | 449 |
| 3Q | 80 | 154 | 329 | 356 |
| 2Q | 76 | 105 | 227 | 271 |
| 1Q | 24 | 30 | 95 | 136 |
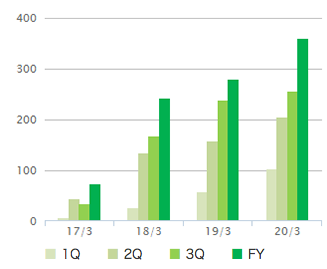
Ordinary income
(Millions of yen)

| 17/3 | 18/3 | 19/3 | 20/3 | |
|---|---|---|---|---|
| FY | 106 | 257 | 386 | 476 |
| 3Q | 62 | 169 | 343 | 369 |
| 2Q | 56 | 115 | 235 | 287 |
| 1Q | 11 | 34 | 102 | 145 |
Profit (loss) attributable to owners of parent
(Millions of yen)
| 17/3 | 18/3 | 19/3 | 20/3 | |
|---|---|---|---|---|
| FY | 74 | 242 | 279 | 360 |
| 3Q | 35 | 168 | 239 | 256 |
| 2Q | 45 | 134 | 157 | 204 |
| 1Q | 7 | 27 | 57 | 103 |
Return on equity
(%)
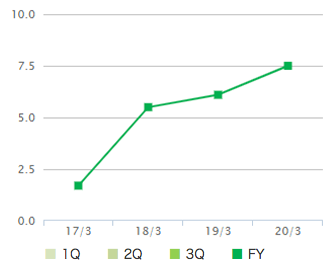
| 17/3 | 18/3 | 19/3 | 20/3 | |
|---|---|---|---|---|
| FY | 1.7 | 5.5 | 6.1 | 7.5 |
| 3Q | - | - | - | - |
| 2Q | - | - | - | - |
| 1Q | - | - | - | - |
Note: The indicators above are updates for each full year.
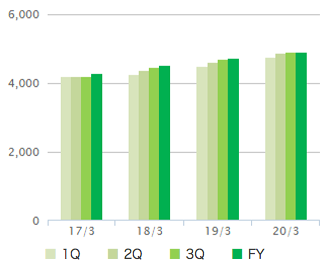
Total assets
(Millions of yen)
| 17/3 | 18/3 | 19/3 | 20/3 | |
|---|---|---|---|---|
| FY | 5,242 | 5,784 | 5,989 | 6,137 |
| 3Q | 5,316 | 5,586 | 5,820 | 6,241 |
| 2Q | 4,934 | 5,487 | 5,780 | 6,164 |
| 1Q | 4,973 | 5,295 | 5,765 | 6,075 |
Net assets
(Millions of yen)
| 17/3 | 18/3 | 19/3 | 20/3 | |
|---|---|---|---|---|
| FY | 4,274 | 4,501 | 4,718 | 4,903 |
| 3Q | 4,187 | 4,444 | 4,677 | 4,907 |
| 2Q | 4,185 | 4,365 | 4,596 | 4,873 |
| 1Q | 4,198 | 4,262 | 4,491 | 4,760 |
Equity ratio
(%)
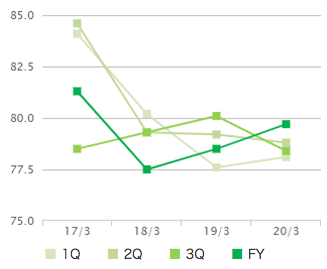
| 17/3 | 18/3 | 19/3 | 20/3 | |
|---|---|---|---|---|
| FY | 81.3 | 77.5 | 78.5 | 79.7 |
| 3Q | 78.5 | 79.3 | 80.1 | 78.4 |
| 2Q | 84.6 | 79.3 | 79.2 | 78.8 |
| 1Q | 84.1 | 80.2 | 77.6 | 78.1 |
Cash flows from operating activities
(Millions of yen)
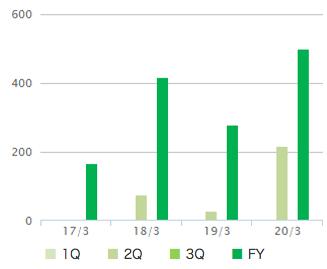
| 17/3 | 18/3 | 19/3 | 20/3 | |
|---|---|---|---|---|
| FY | 167 | 417 | 278 | 498 |
| 3Q | - | - | - | - |
| 2Q | 5 | 74 | 29 | 217 |
| 1Q | - | - | - | - |
Cash flows from investing activities
(Millions of yen)
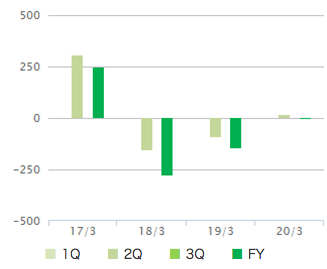
| 17/3 | 18/3 | 19/3 | 20/3 | |
|---|---|---|---|---|
| FY | 248 | △278 | △144 | △3 |
| 3Q | - | - | - | - |
| 2Q | 306 | △153 | △90 | 16 |
| 1Q | - | - | - | - |
Cash flows from financing activities
(Millions of yen)
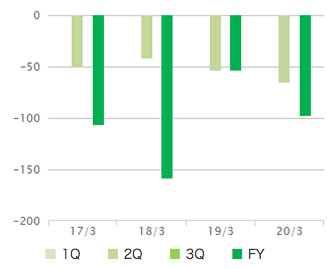
| 17/3 | 18/3 | 19/3 | 20/3 | |
|---|---|---|---|---|
| FY | △106 | △158 | △53 | △98 |
| 3Q | - | - | - | - |
| 2Q | △51 | △42 | △53 | △65 |
| 1Q | - | - | - | - |
Cash and cash equivalents at end of period
(Millions of yen)
| 17/3 | 18/3 | 19/3 | 20/3 | |
|---|---|---|---|---|
| FY | 914 | 897 | 974 | 1,363 |
| 3Q | - | - | - | - |
| 2Q | 864 | 791 | 780 | 1,133 |
| 1Q | - | - | - | - |
Notes: 1. The second quarter (Q2) is the cumulative total from the first quarter to the second quarter.
2. The third quarter (Q3) is the cumulative total from the first quarter to the third quarter.
- When revisions to summaries of financial statements and other financial information are announced, those revisions are not reflected immediately in the data posted here.
- Relevant indicators are not adjusted retroactively when a stock split or other such change has been made.
- The frequency of updating information may change with changes in the form of summaries of financial statements, etc.